The TI assessment is based on a "profile" of the 1,000 teachers studied and applicants are measured (graded) based on correlation between their responses and the "profile" response. As noted in an article in the Dallas Morning News:
Gallup would not release its test but provided one question without answering it: "When students say they want their teachers to be fair, what do they mean?" Applicants choose from among four answers. It may seem like a subjective question, but according to Gallup, the best teachers all answer the same way. "There's quite a bit of consistency in their behavior," Gary Gordon, vice president of Gallup's Education Division, said of the best teachers. "They don't distinguish between students as much."As discussed in The (Non)Predictive Ability of the Gallup TeacherInsight Assessment there is little evidence linking teachers' test scores to student achievement and teacher effectiveness.
Correlation vs Causation
TI assessment scoring is predicated on correlations among various data elements. Correlations let us analyze a phenomenon (teacher effectiveness) not by shedding light on its inner workings but by identifying a (hopefully) useful proxy for it. Of course, even strong correlations are never perfect. It is quite possible that two things may behave similarly just by coincidence. We may simply be “fooled by randomness” to borrow a phrase from the empiricist Nassim Nicholas Taleb. With correlations, there is no certainty, only probability.
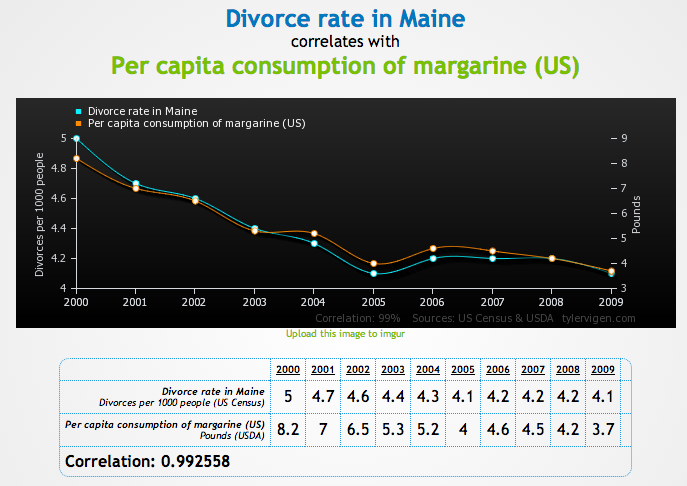
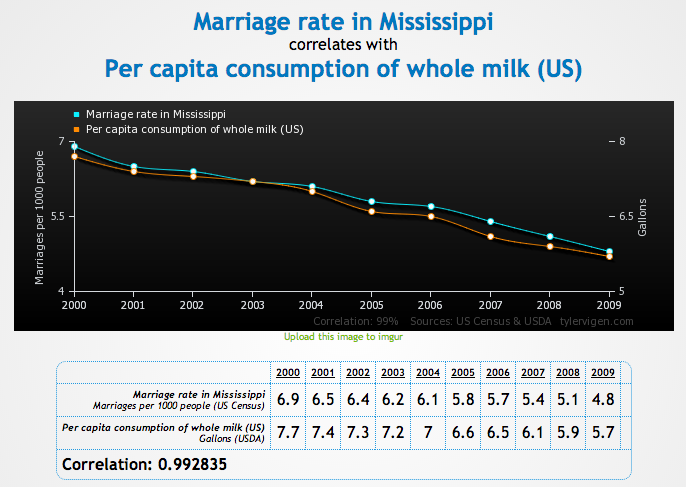
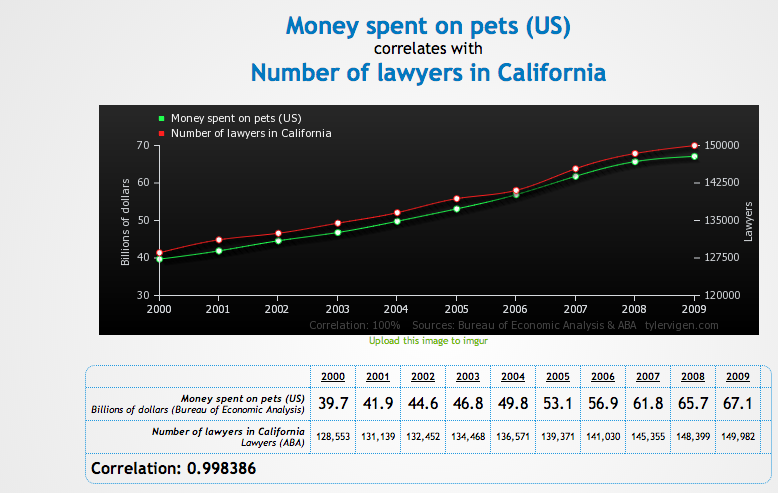
Decisions made or affected by correlation are inherently flawed. Correlation does not equal causation. This point is made vividly by Tyler Vigen, a law student at Harvard who put together a website that finds very, very high correlations - as shown below - between things that are absolutely not related.
While many companies foster an illusion that scoring/classification is an area of absolute algorithmic rule—that decisions are neutral, organic, and even automatically rendered without human intervention—reality is a far messier mix of technical and human curating. Both the datasets and the algorithms used to analyze the data reflect choices, among others, about connections, inferences, and interpretation.
Theories about teacher effectiveness shape both methods used in the TI assessment and the results of that assessment. It begins with how the data was selected and what is chosen influences what is found. Similarly, when Gallup analyzes the data, it chooses tools that rest on theories. And as it interprets the results it again applies theories.
Seizing Opportunities, Preserving Values
The recent White House report, “Big Data: Seizing Opportunities, Preserving Values," found that, "while big data can be used for great social good, it can also be used in ways that perpetrate social harms or render outcomes that have inequitable impacts, even when discrimination is not intended." The fact sheet accompanying the White House report warns:
As more decisions about our commercial and personal lives are determined by algorithms and automated processes, we must pay careful attention that big data does not systematically disadvantage certain groups, whether inadvertently or intentionally. We must prevent new modes of discrimination that some uses of big data may enable, particularly with regard to longstanding civil rights protections in housing, employment, and credit.

Workforce assessment systems like Gallup's TeacherInsight, designed in part to mitigate risks for employers, have become sources of material risk, both to job applicants and employers. The systems create the perception of stability through probabilistic reasoning and the experience of accuracy, reliability, and comprehensiveness through automation and presentation. But in so doing, technology systems draw attention away from uncertainty and partiality.
As more and more school districts seek to broaden their teaching staff to include more ethnically, linguistically, and culturally diverse teachers, it is imperative to make the selection and hiring practices of teachers more transparent.
No comments:
Post a Comment
Because I value your thoughtful opinions, I encourage you to add a comment to this discussion. Don't be offended if I edit your comments for clarity or to keep out questionable matters, however, and I may even delete off-topic comments.